

The EcoPure Effect: 2026 - The Data Behind the Single-Use Switch
EcoPure Waters' clients in the UK and Ireland save a combined 16 million single-use (750ml) bottles and more than 4,500 tonnes of CO2 emissions every year by switching from single-use bottled water to on-site refill systems. This report compares the cost of single-use bottled water with on-site filtration systems, and savings hold up against both single-use plastic and single-use glass bottled water.
Where EcoPure Waters is used
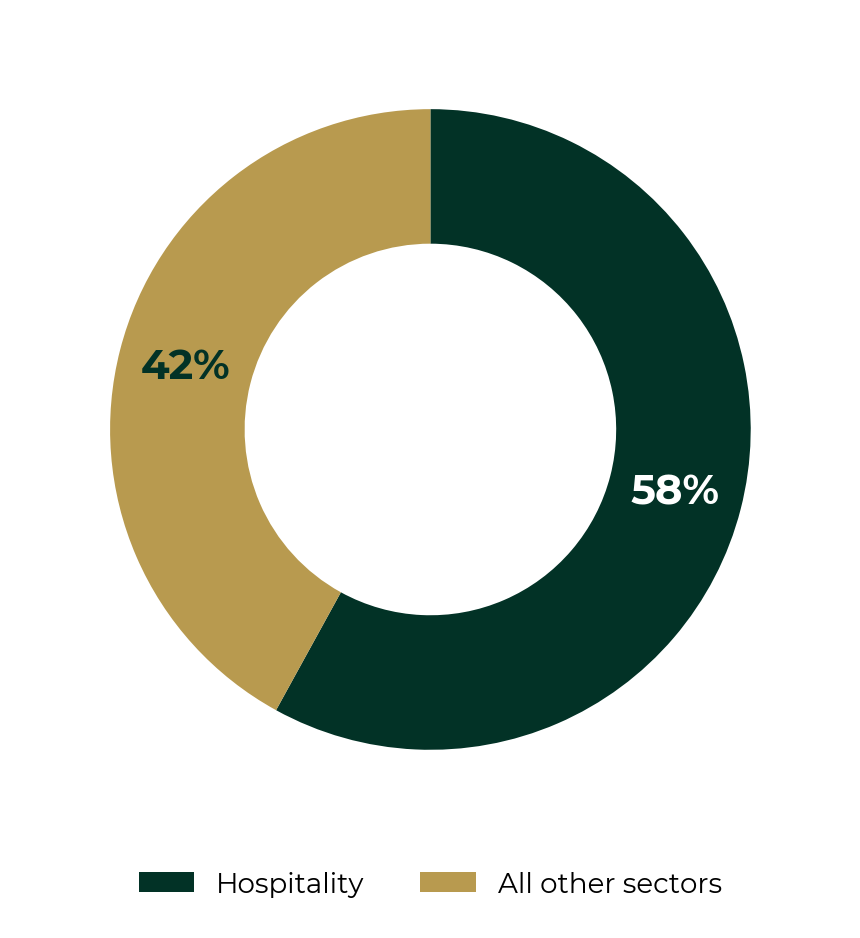
58% of EcoPure Waters' total client water usage comes from the hospitality sector (see how our water filtration solutions work for UK and Ireland hotels and restaurants). The other 42%: education and care homes together account for close to two-thirds of usage outside hospitality. Both are sectors where cost predictability and duty-of-care around water quality matter as much as sustainability.
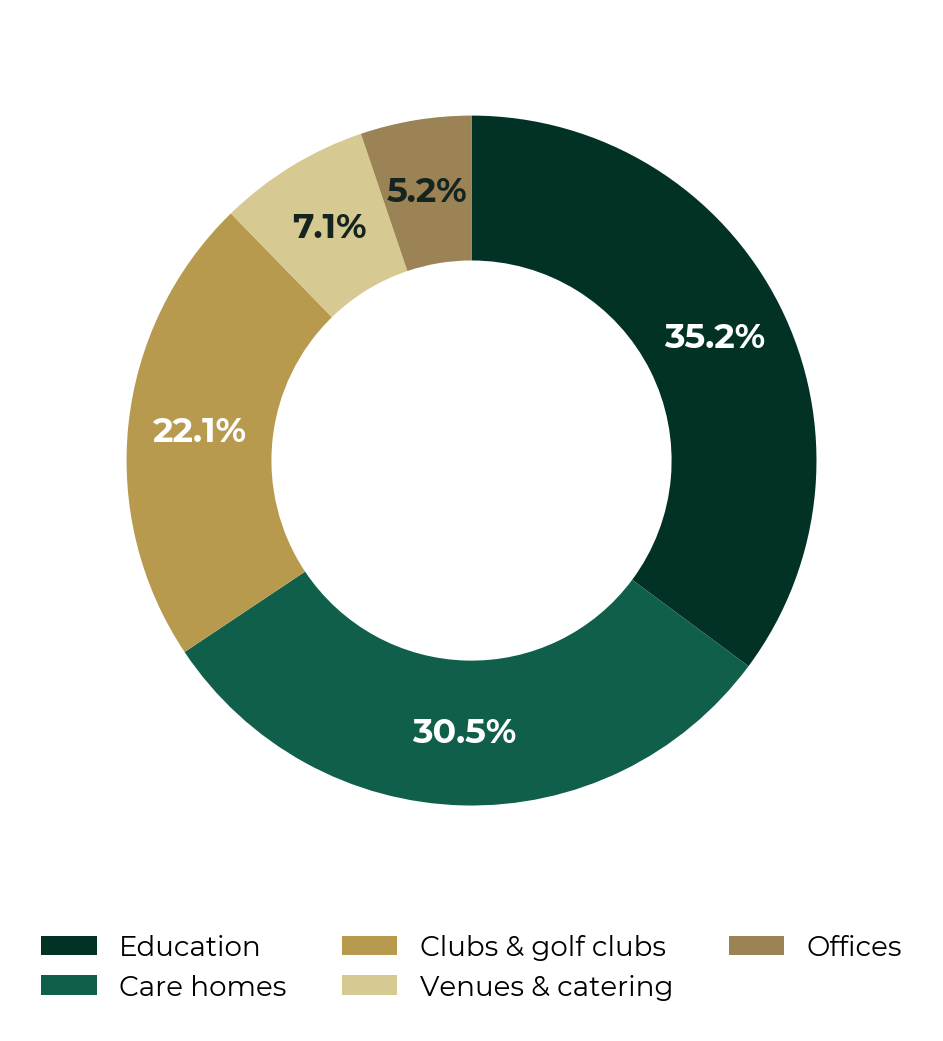
| Sector | Share of usage |
|---|---|
| Hospitality | 58% of total usage |
| Education | 35% of non-hospitality usage |
| Care homes | 31% of non-hospitality usage |
| Clubs & golf clubs | 22% of non-hospitality usage |
| Venues & catering | 7% of non-hospitality usage |
| Offices | 5% of non-hospitality usage |
Is single-use glass bottled water actually more sustainable than plastic?
No. This is the assumption that catches most venues out. Once production, transport, waste collection and recycling are accounted for, single-use glass carries a heavier carbon footprint than single-use plastic. It's also the more expensive format to buy in.
Venues that switched from plastic to glass are, on the data, worse off on both carbon and cost than if they'd stayed with plastic, and significantly worse off than an on-site refill system.
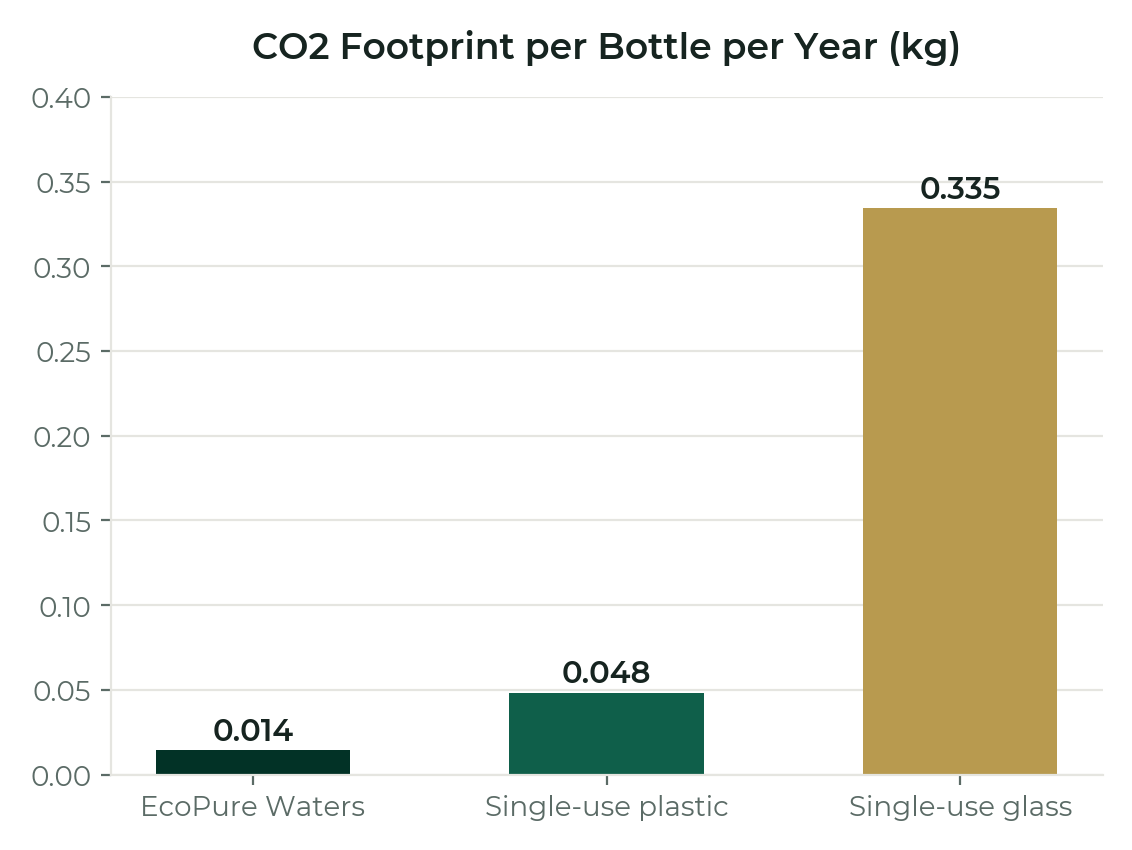
| Format | kg CO2 / bottle / year |
|---|---|
| EcoPure Waters (refillable) | 0.014 kg |
| Single-use plastic | 0.048 kg |
| Single-use glass | 0.335 kg |
How many single-use bottles does switching to EcoPure Waters displace?
Rising from 9,125 bottles a year at 25 bottles/day to 73,000 bottles a year at 200 bottles/day per site. Across EcoPure Waters' full client base, this adds up to 16 million single-use bottles saved annually.
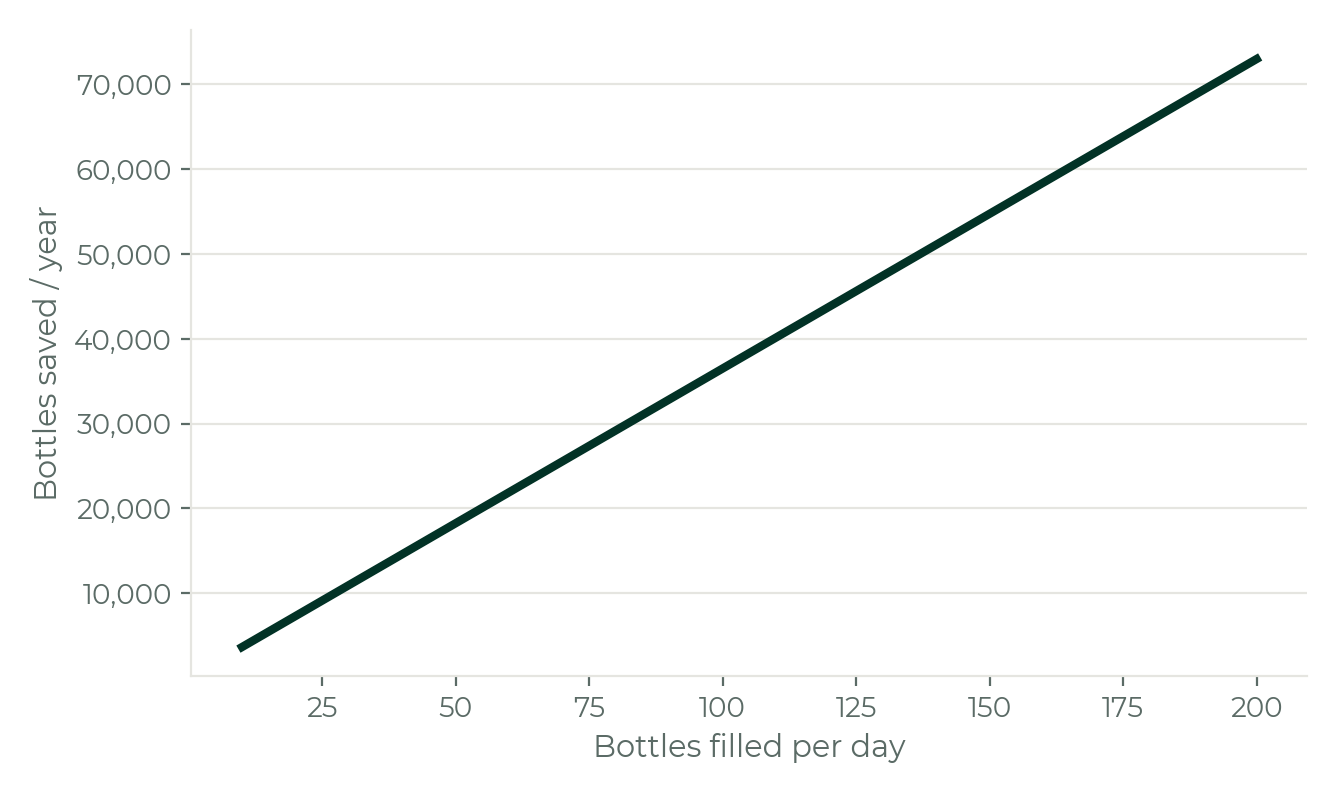
| Bottles filled per day | Bottles saved per year |
|---|---|
| 25 | 9,125 |
| 50 | 18,250 |
| 100 | 36,500 |
| 150 | 54,750 |
| 200 | 73,000 |
How much CO2 does switching to EcoPure Waters actually save?
It scales directly with how much water a site fills. A venue filling 200 bottles a day saves roughly 2.47 tonnes of CO2 a year against single-use plastic, and roughly 23 tonnes a year against single-use glass. Across EcoPure Waters' full client base, that adds up to more than 4,500 tonnes of CO2 avoided annually.
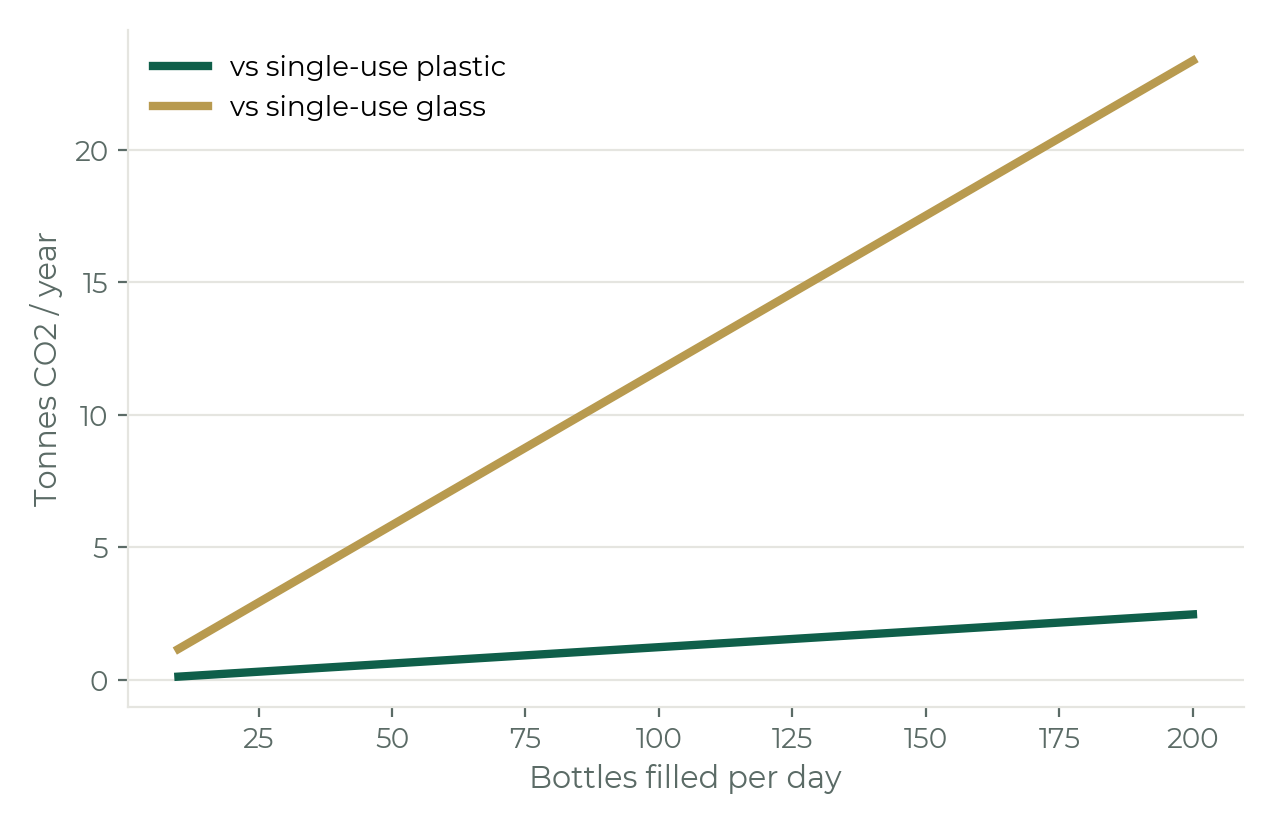
| Bottles filled per day | vs single-use plastic | vs single-use glass |
|---|---|---|
| 25 | 0.31 | 2.92 |
| 50 | 0.62 | 5.84 |
| 100 | 1.24 | 11.68 |
| 150 | 1.85 | 17.53 |
| 200 | 2.47 | 23.37 |
How much does an EcoPure Waters system cost per bottle?
Higher-volume sites benefit from bottles that become progressively cheaper to run, falling from about £0.27 at 50 bottles/day to about £0.19 at 200 bottles/day.
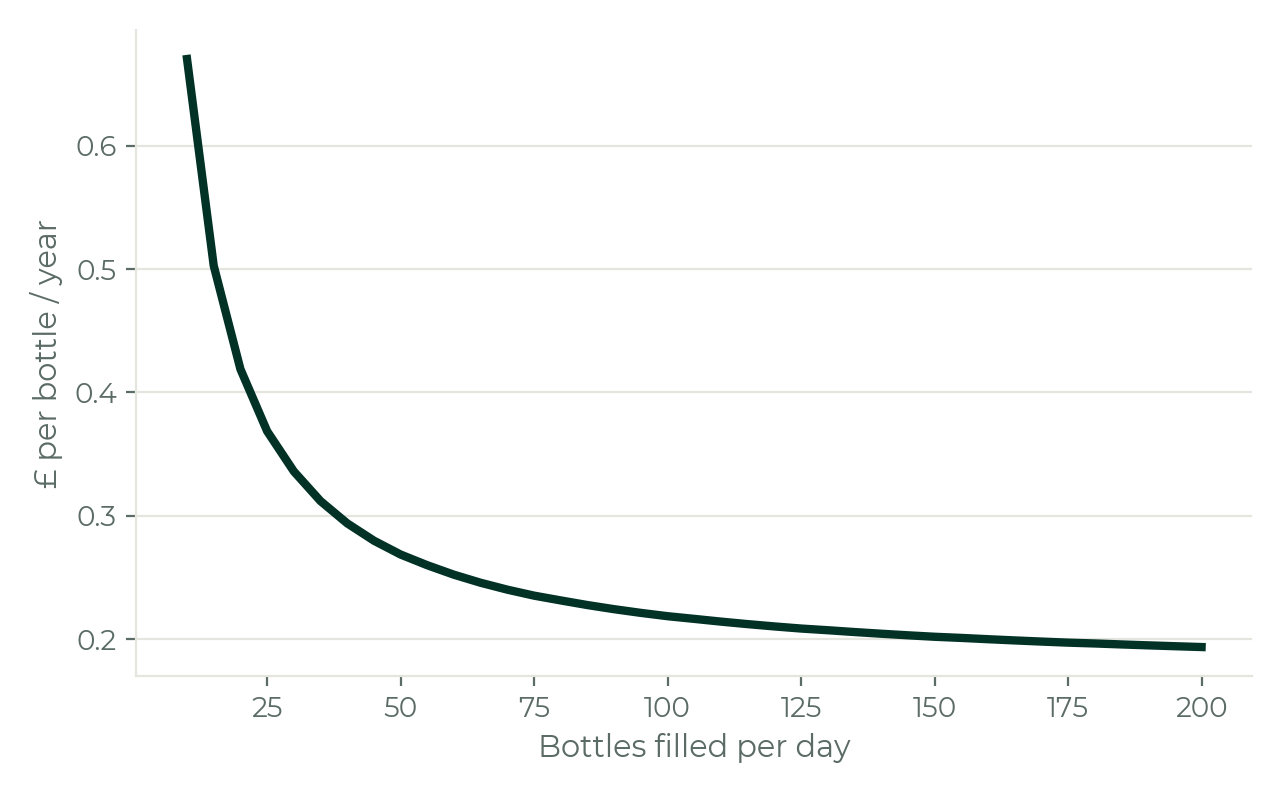
| Bottles filled per day | £ per bottle |
|---|---|
| 25 | £0.37 |
| 50 | £0.27 |
| 100 | £0.22 |
| 150 | £0.20 |
| 200 | £0.19 |
How much do you save per bottle vs single-use?
Savings per bottle scale directly with how much water a site fills, then level off at higher volumes.
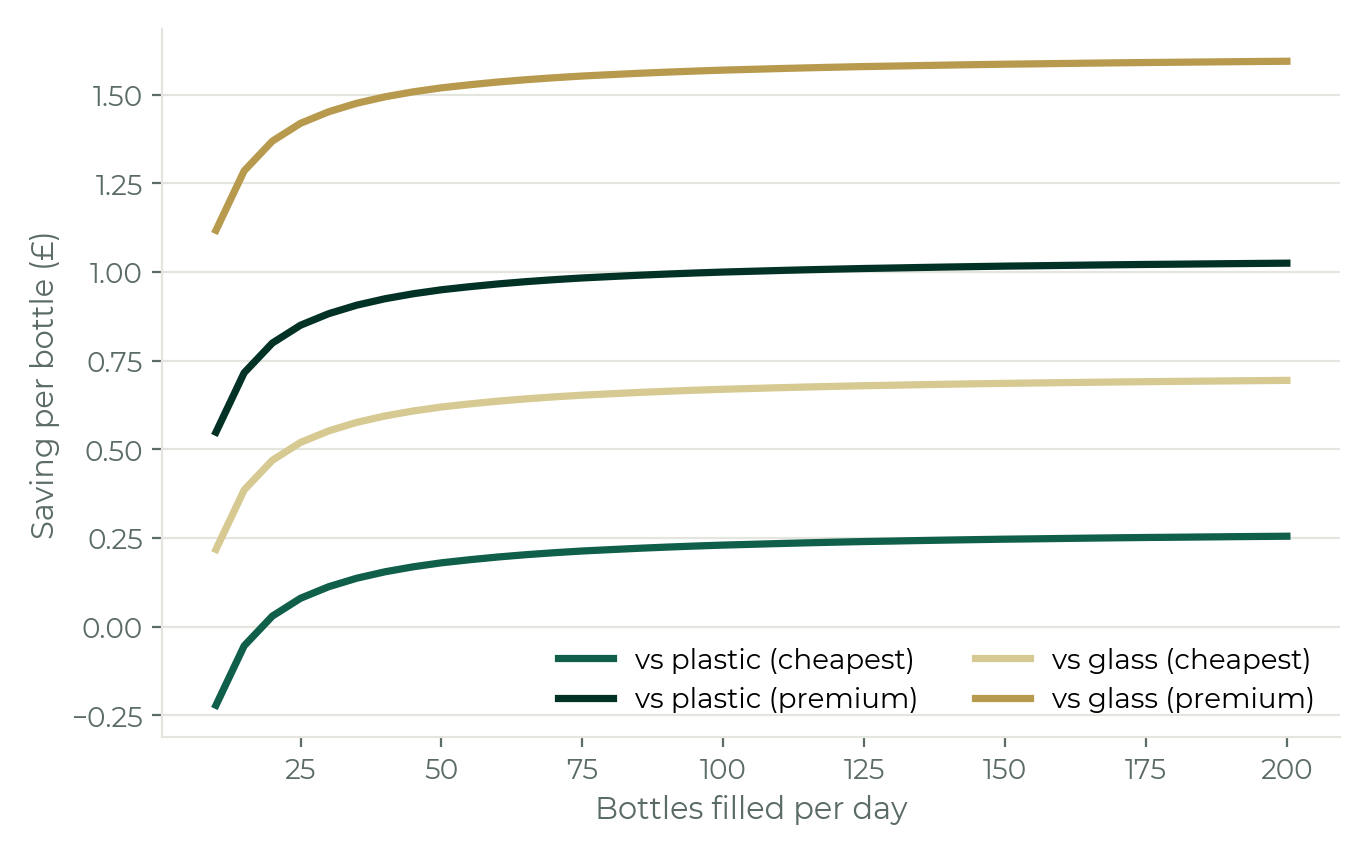
| Comparison | Saving per bottle |
|---|---|
| vs cheapest plastic | £0.27 |
| vs premium plastic | £1.04 |
| vs cheapest glass | £0.71 |
| vs premium glass | £1.61 |
What makes up the cost per bottle?
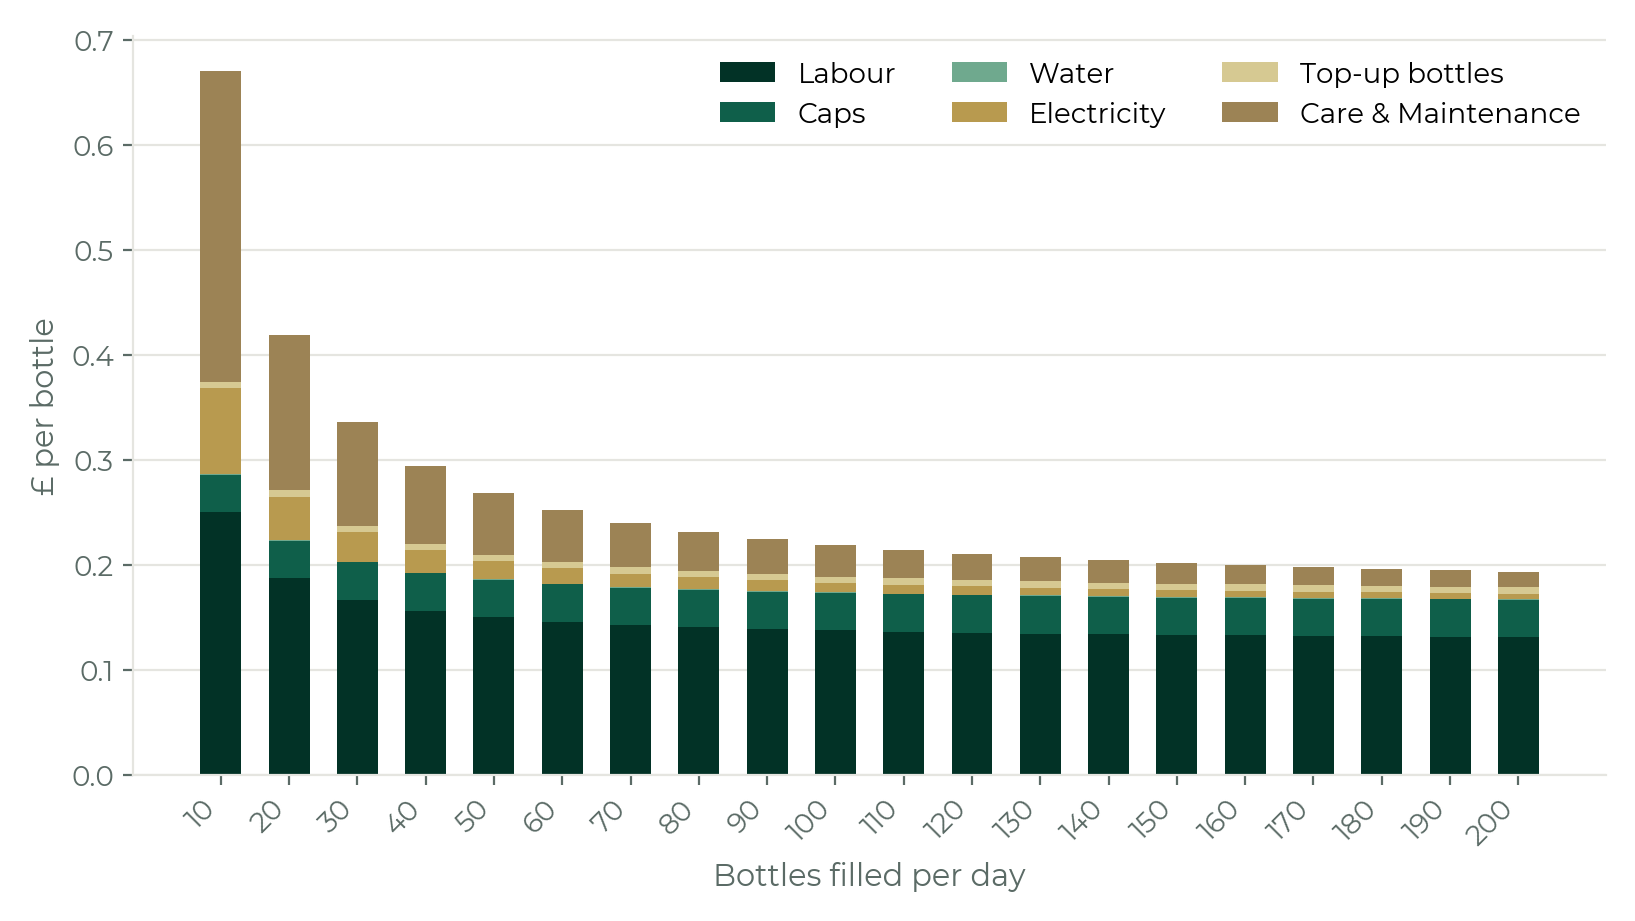
Labour is the largest and most stable cost component. Care & maintenance cost per bottle falls fastest as volume increases, and costs reduce further with reusable cap and swing-stopper bottle styles.
How long does payback on a system and branded bottles take?
In three of the four comparisons, both glass tiers and premium plastic, payback on an EcoPure Waters system (including branded bottles and ancillaries) is within 12 months once daily usage passes 25 bottles a day, and within 6 months above 50 bottles a day. The exception is the cheapest-tier plastic, the hardest comparison to beat on price alone: payback clears 12 months around 75 bottles a day.
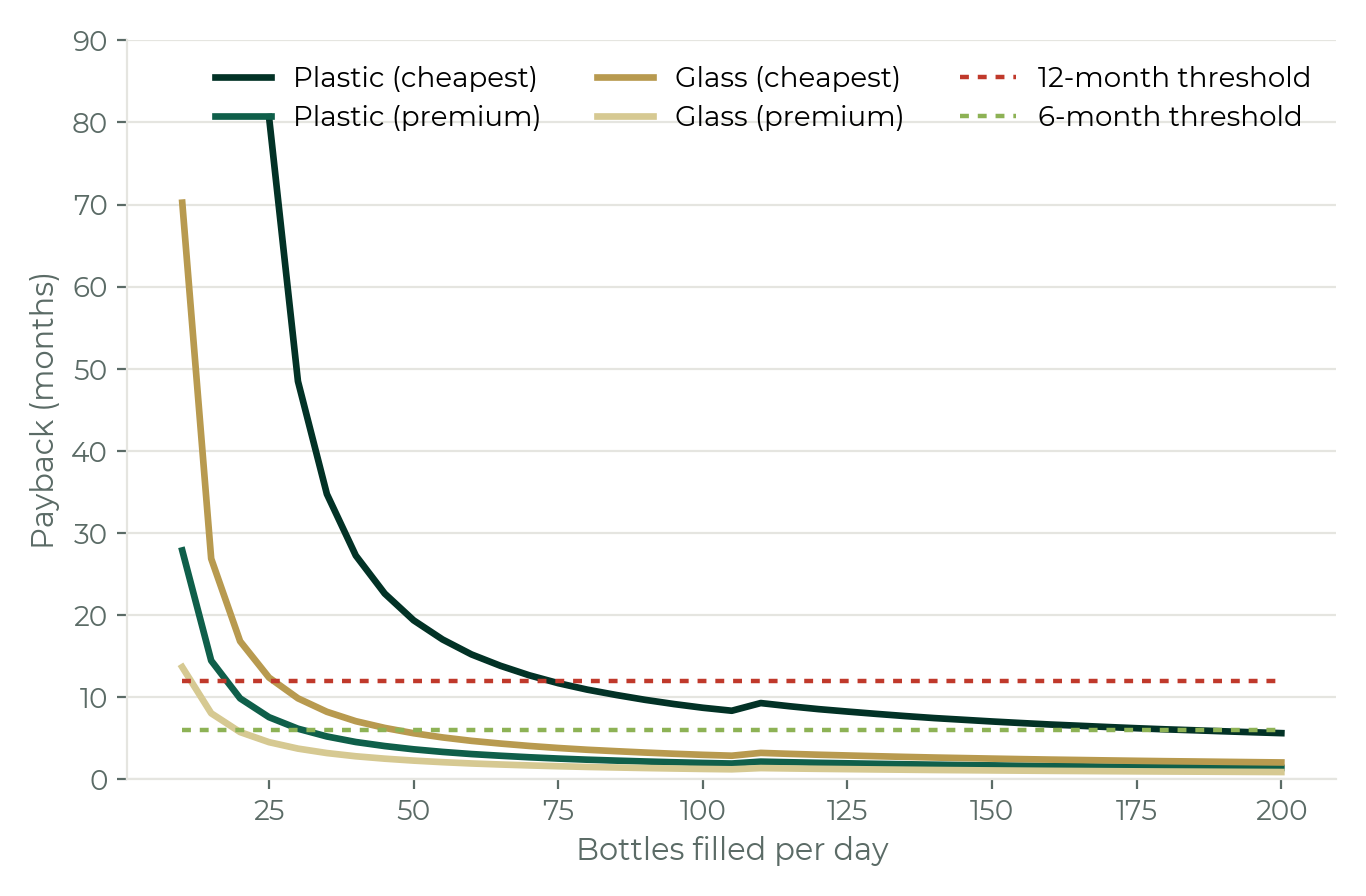
| Comparison | At 50 bottles/day | At 200 bottles/day |
|---|---|---|
| vs cheapest plastic | 19.4 | 5.6 |
| vs premium plastic | 3.7 | 1.4 |
| vs cheapest glass | 5.6 | 2.1 |
| vs premium glass | 2.3 | 0.9 |
How much can be saved annually with an EcoPure Waters solution?
Savings from £3,000 annually (vs cheapest plastic) for 50 bottles filled per day, to over £115,000 annually (vs premium glass) for 200 bottles filled per day. The greater your usage, the greater the savings.
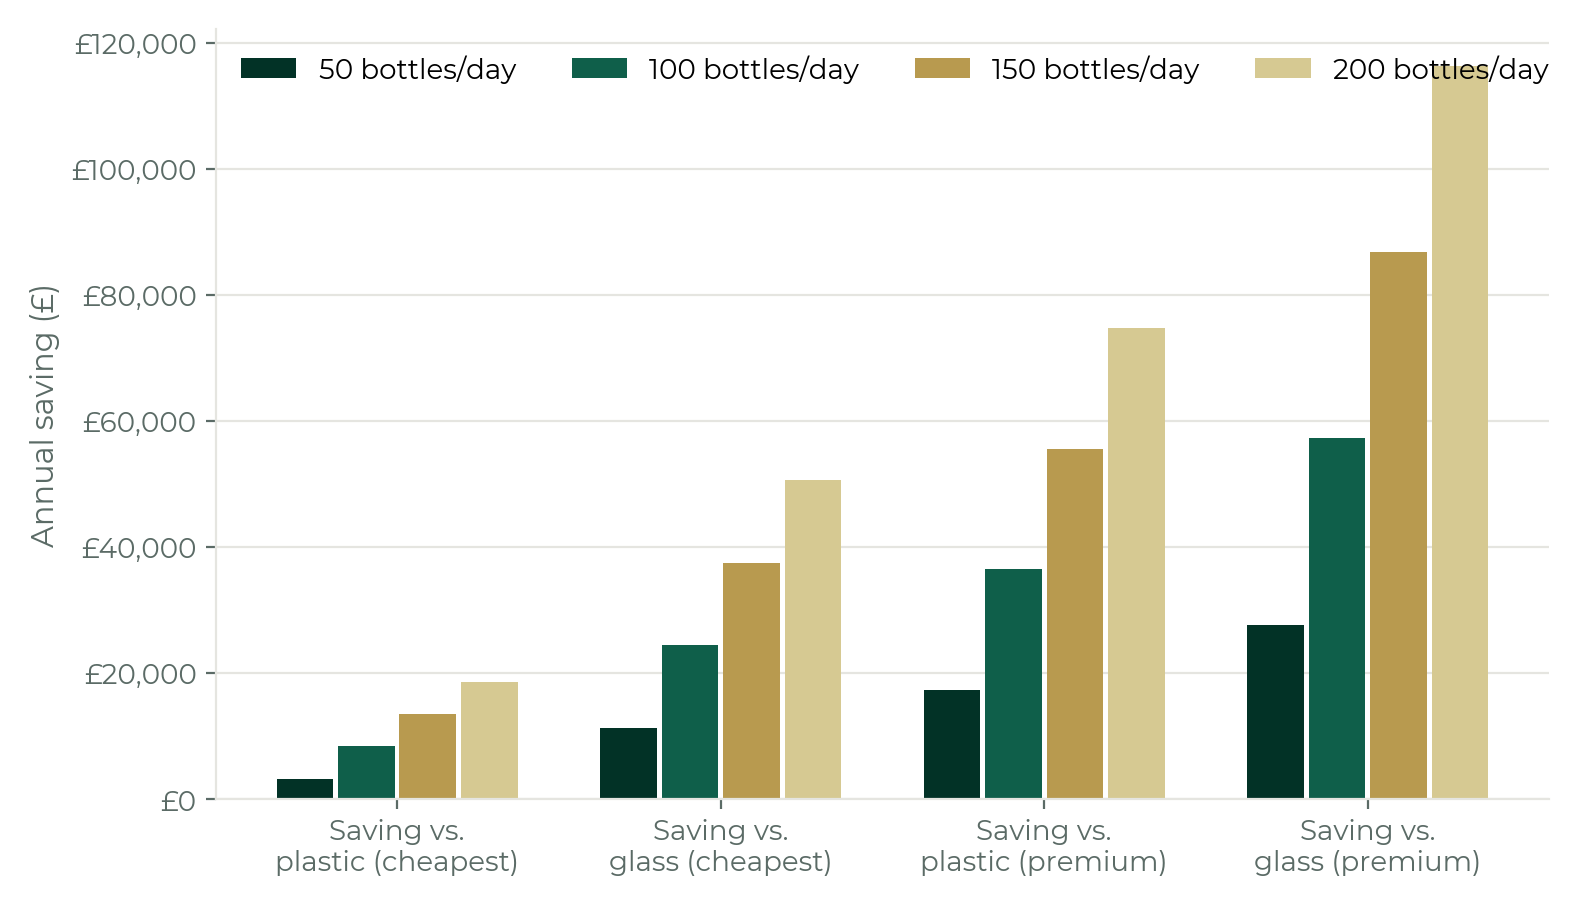
| Comparison | 50/day | 100/day | 150/day | 200/day |
|---|---|---|---|---|
| vs cheapest plastic | £3,282 | £8,390 | £13,497 | £18,604 |
| vs cheapest glass | £11,302 | £24,430 | £37,557 | £50,684 |
| vs premium plastic | £17,335 | £36,495 | £55,655 | £74,814 |
| vs premium glass | £27,727 | £57,280 | £86,832 | £116,384 |
Why the lifecycle is the real difference
Every single-use bottle, plastic or glass, repeats the same six-stage cycle indefinitely: manufacture, packaging, delivery, storage, waste collection and recycling, before the cycle starts again with a new bottle. Each stage carries its own carbon and cost, and it repeats every single time a bottle is used.
EcoPure Waters replaces that loop with three steps that happen once: a single manufacture, a single delivery, and then indefinite reuse on-site. There's no repeat production run, no repeat packaging, and no repeat waste collection for every bottle consumed.
Single-use (plastic or glass)
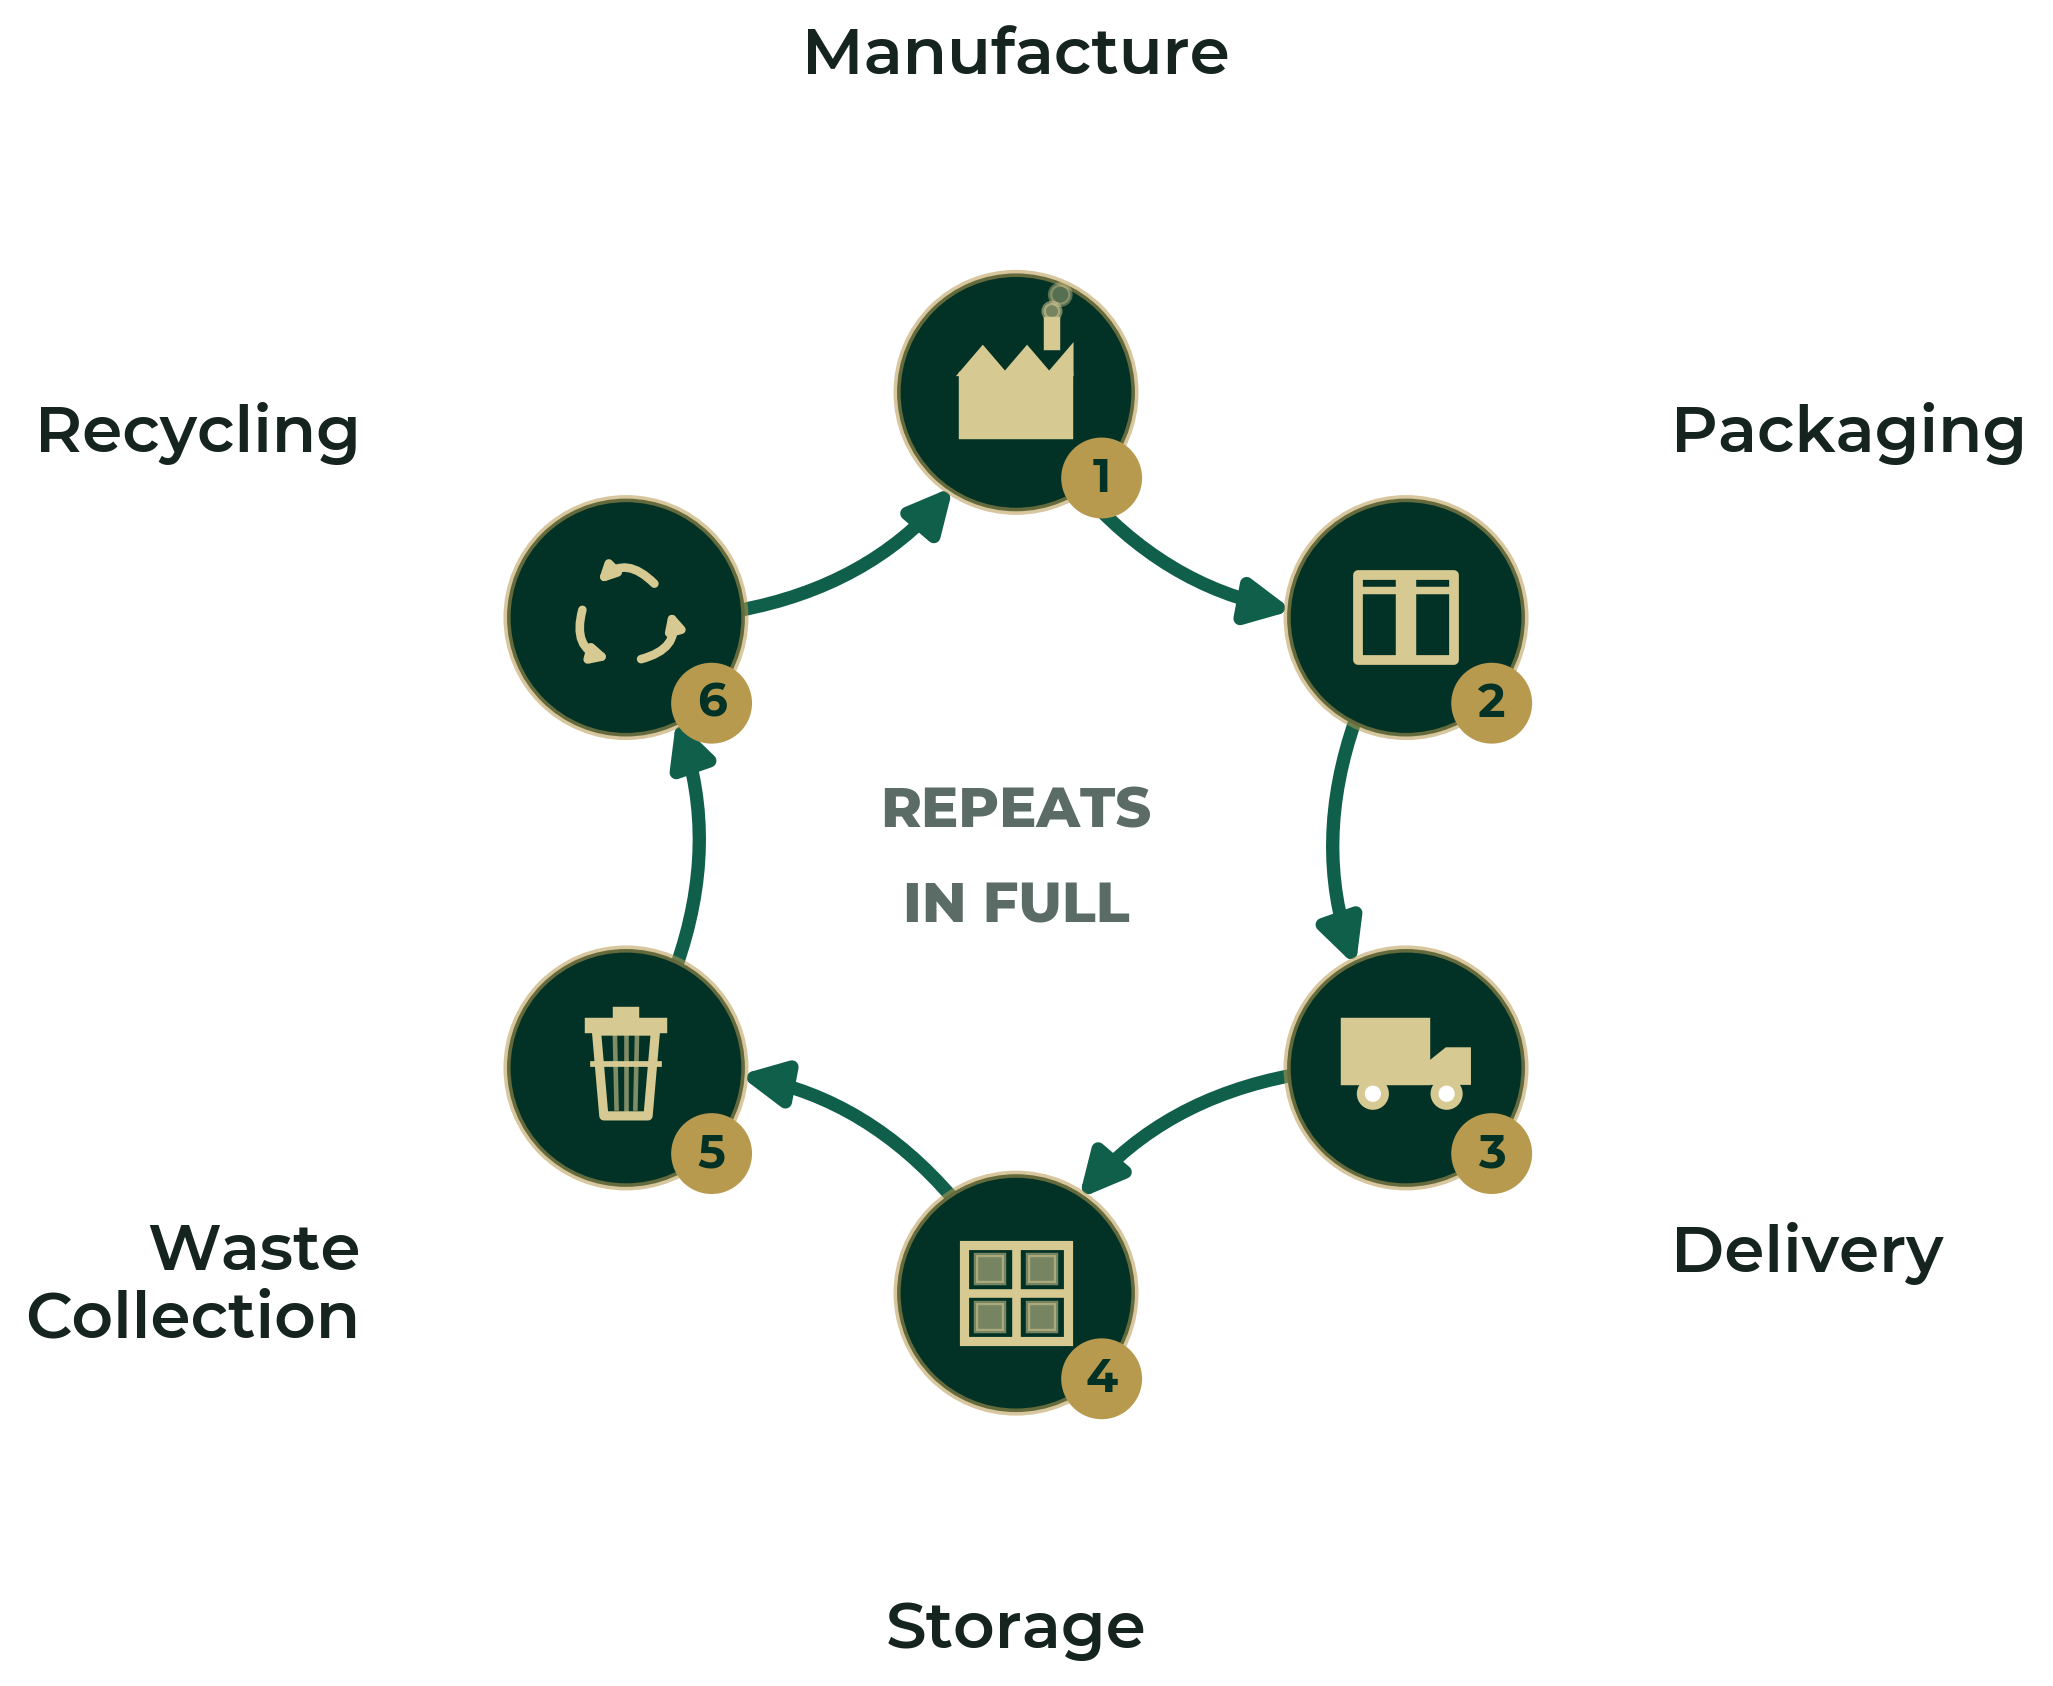
Repeats in full, every single bottle, every single time.
EcoPure Waters
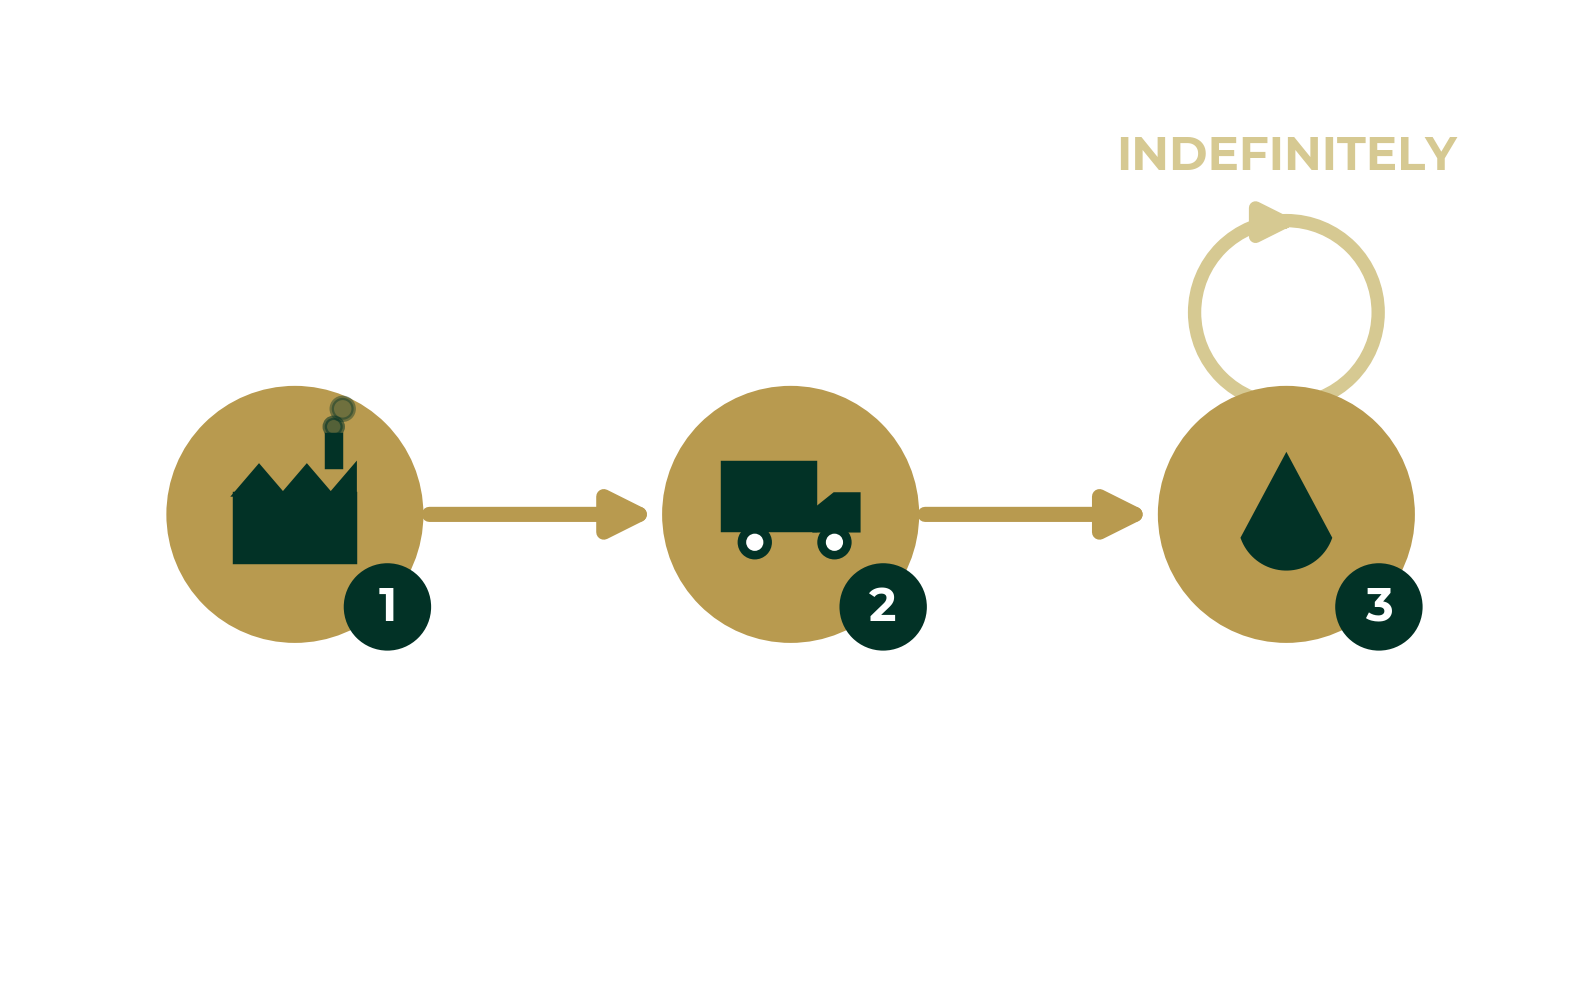
One manufacture. One delivery. Then reuse, on loop — no repeat production, no repeat waste.
Frequently asked questions
How many bottles does EcoPure Waters save per year?
EcoPure Waters' clients save a combined 16 million single-use (750ml) bottles annually.
How much CO2 does EcoPure Waters save per year?
More than 4,500 tonnes of CO2 emissions are avoided annually across EcoPure Waters' client base.
Is single-use glass bottled water more sustainable than plastic?
No. Glass has a heavier footprint (0.335 kg CO2 per bottle per year) than plastic (0.048 kg), once production, kiln firing, transport, waste collection and recycling are included.
How long does payback on a system and branded bottles take?
Typically under 12 months, often under 6 at higher volumes.
What is the cost per bottle of water (750ml) with on-site filtration?
Typically down to 19p per bottle.
How much can be saved annually with an EcoPure Waters solution?
Savings range from around £3,000 annually (vs cheapest plastic) for 50 bottles filled per day, to over £115,000 annually (vs premium glass) for 200 bottles filled per day.
What industries use EcoPure Waters?
Hospitality is 58% of usage; the rest spans education, care homes, clubs/golf, venues/catering and offices.
Get in touch
EcoPure Waters
9 Alexander House
Thame Road
Haddenham
Buckinghamshire
UK
HP17 8BZ
+44 (0)1844 290088
enquiries@ecopurewaters.com
https://ecopurewaters.com